[ AI demand forecasting ]
Plan Production, Staffing and Stock From One Forecast Everyone Trusts
We build forecasting systems that predict demand from total company level down to product and region, account for promotions and launches, and plug into your S&OP process.
- Totals and details that always add up
- Hierarchical
- Totals and details that always add up
- Uplift and cannibalization modeled
- Promotions
- Uplift and cannibalization modeled
- Feeds planning meetings and ERP
- S&OP ready
- Feeds planning meetings and ERP
Units forecast, all regions: 16,400
 NorthCore range4,185
Example forecast. Every tile adds up to its region, every region to the total.
Why Demand Plans Drift From Reality
Forecasts built in separate spreadsheets rarely agree, and nobody trusts the final number.
Sales says
55,000
Pipeline and targets
Finance says
46,500
Budget and run rate
Operations says
49,800
Last year plus growth
Marketing says
52,600
Campaign calendar
Four example forecasts for the same quarter, built in four spreadsheets.
- 01
Plans that do not add up
Sales, finance and operations each keep their own forecast, and the planning meeting is spent arguing about whose number is right.
- 02
Promotions distort history
Past campaigns inflate the baseline, so next year's plan expects a lift that only happened because of a discount.
- 03
New products guessed
Launches are planned from instinct and a hopeful sales target, then end up overstocked or sold out in week two.
- 04
Late exceptions
Big misses surface at month end, after production runs, shifts and purchase orders are already locked in.
Four Forecasts In, One Number Out
Every team keeps its view, but the plan runs on one reconciled forecast that adds up from product to company total. Example figures for one quarter.
- 1
Each team's number is read in as an input, not thrown away.
- 2
The model forecasts every product and region from orders, prices and promotions.
- 3
Lower levels are reconciled so they add up to the company total.
- 4
Planners see one consensus number, with every override tracked.
Next quarter, units (example)
- Sales55,000
- Finance46,500
- Operations49,800
- Marketing52,600
Reconciled from product and region forecasts, so every level adds up to this total.
What a Promotion Really Adds
The model separates the real gain from the noise around it, so a two-week discount does not become next year's baseline. One example campaign:
Baseline demand
Promotion uplift
Taken from a sister product
Dip after the promotion
Net gain
How We Build Your Forecasting System
We backtest against your current plan, then embed the forecast in your planning cycle.
Start With a Backtest- 01
Planning review
We map your hierarchy, planning horizons, S&OP calendar and current forecast method.
Output: Forecast design
- 02
Data and drivers
Sales, orders, promotions, prices and outside drivers are cleaned and joined.
Output: Driver dataset
- 03
Model backtest
Hierarchical models are compared with your current forecast across past cycles.
Output: Accuracy by level and horizon
- 04
Planning integration
Forecasts, exceptions and scenarios feed dashboards, S&OP meetings and your ERP.
Output: Live forecasting cycle
What the System Does
One forecast for every team, explained and easy to adjust.
- 01 / 06
Hierarchical forecasts
Company, category, product, region and channel levels reconciled.
- 02 / 06
Promotion modeling
Uplift, halo and cannibalization from planned campaigns.

- 03 / 06
New product forecasts
Launch curves from similar past products and attributes.
- 04 / 06
S&OP integration
Consensus numbers, overrides and versions for planning meetings.

- 05 / 06
Exception management
Items drifting from forecast surfaced early, ranked by impact.

- 06 / 06
Scenarios
What-if plans for price changes, supply limits or new markets.
Built Into Your Monthly Planning Cycle
The forecast arrives when each meeting needs it, with the exceptions already ranked.
Data the Models Use
We test each driver in the backtest and keep only the ones that improve accuracy at the level you plan on.
- 01Orders and shipments
- 02Promotions and pricing
- 03Product hierarchy and attributes
- 04Customer and channel data
- 05Economic and market indicators
- 06Weather and calendar events
Models
- Prophet
- XGBoost
- LSTM networks
- Hierarchical reconciliation



Data
- Snowflake
- dbt
- Apache Airflow
- PostgreSQL

BI
- Power BI
- Tableau
- Looker

Planning
- SAP IBP
- Anaplan
- Oracle


What We Measure With You
Targets are set during the backtest; results depend on your data and planning process.
- 01
Forecast error
Error by level and horizon versus your current plan
- 02
Forecast bias
Consistent over- or under-forecasting
- 03
Inventory cost
Holding and obsolescence cost
- 04
Expedites
Emergency orders and overtime
Where It Fits
- ManufacturingProduction plans and raw material purchasing.
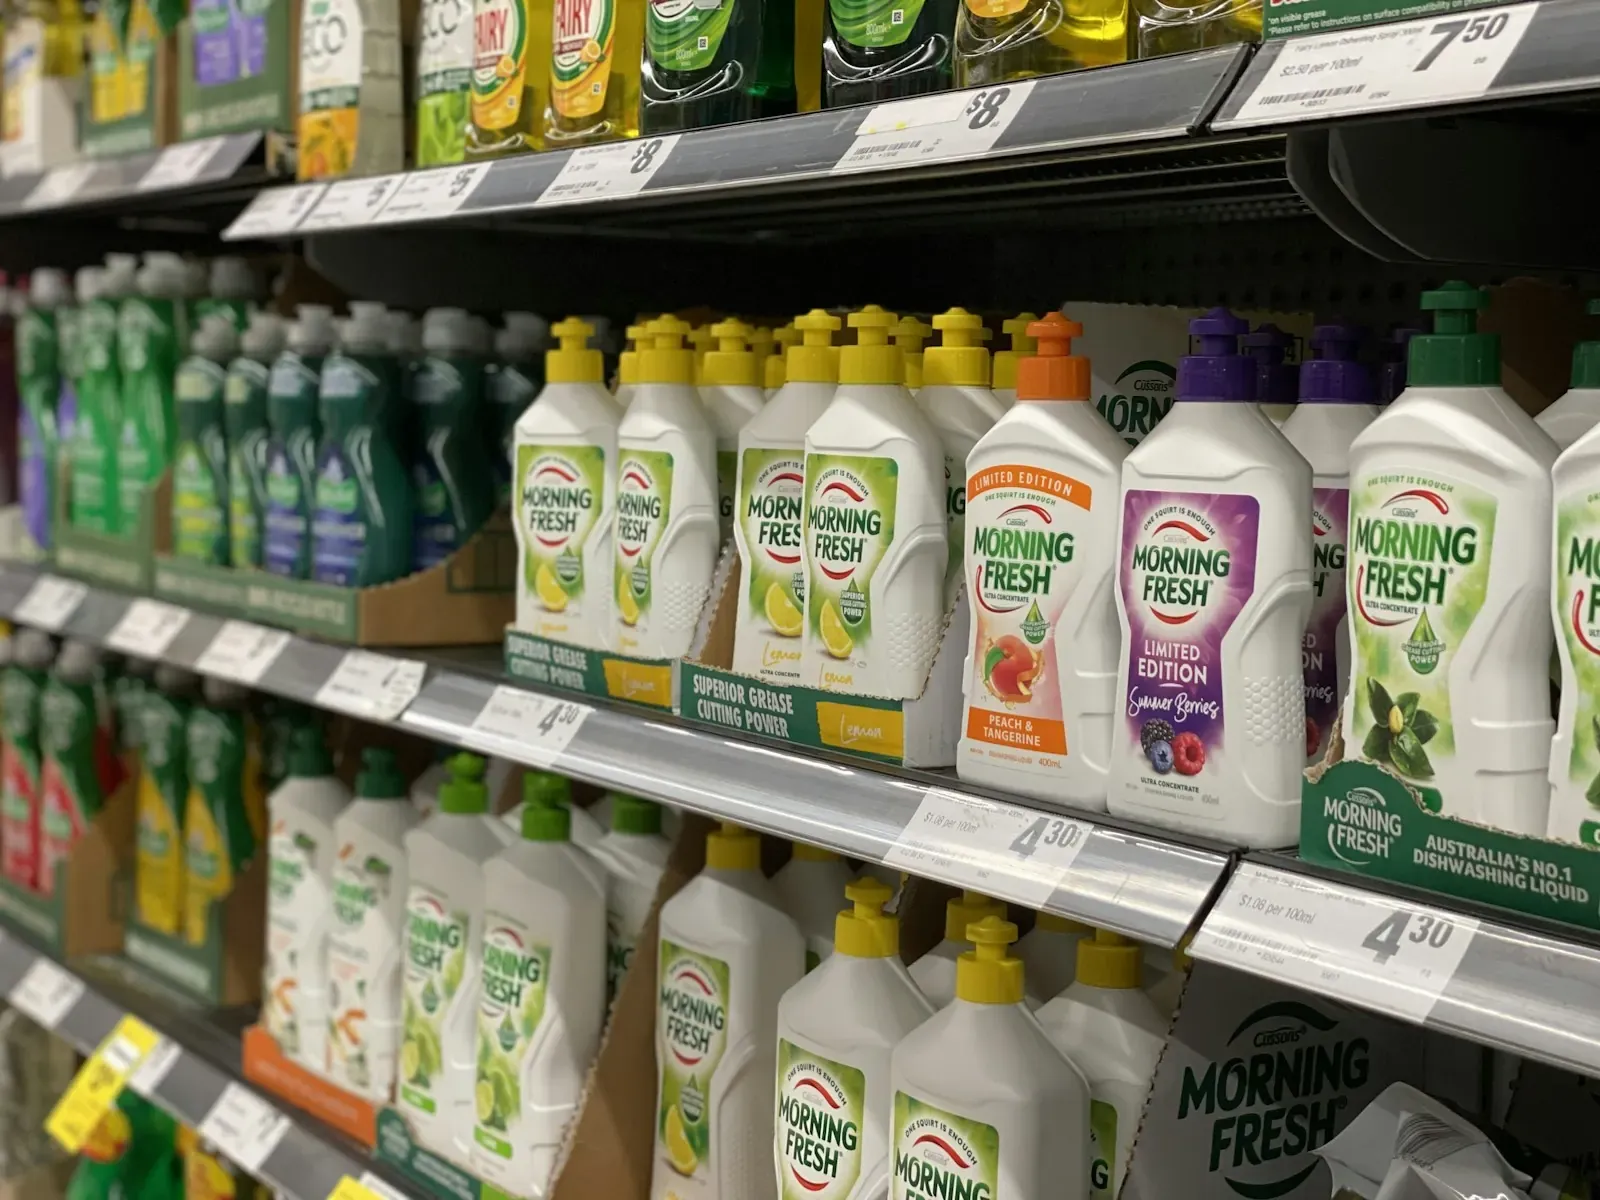
- CPG and FMCGRetailer demand with heavy promotion calendars.
- RetailStore and online demand by category and region.
- Wholesale distributionCustomer orders across many warehouses.
- PharmaceuticalsDemand for critical products with long lead times.
[ One forecast ]
From the Plant Floor to the Loading Dock, One Number
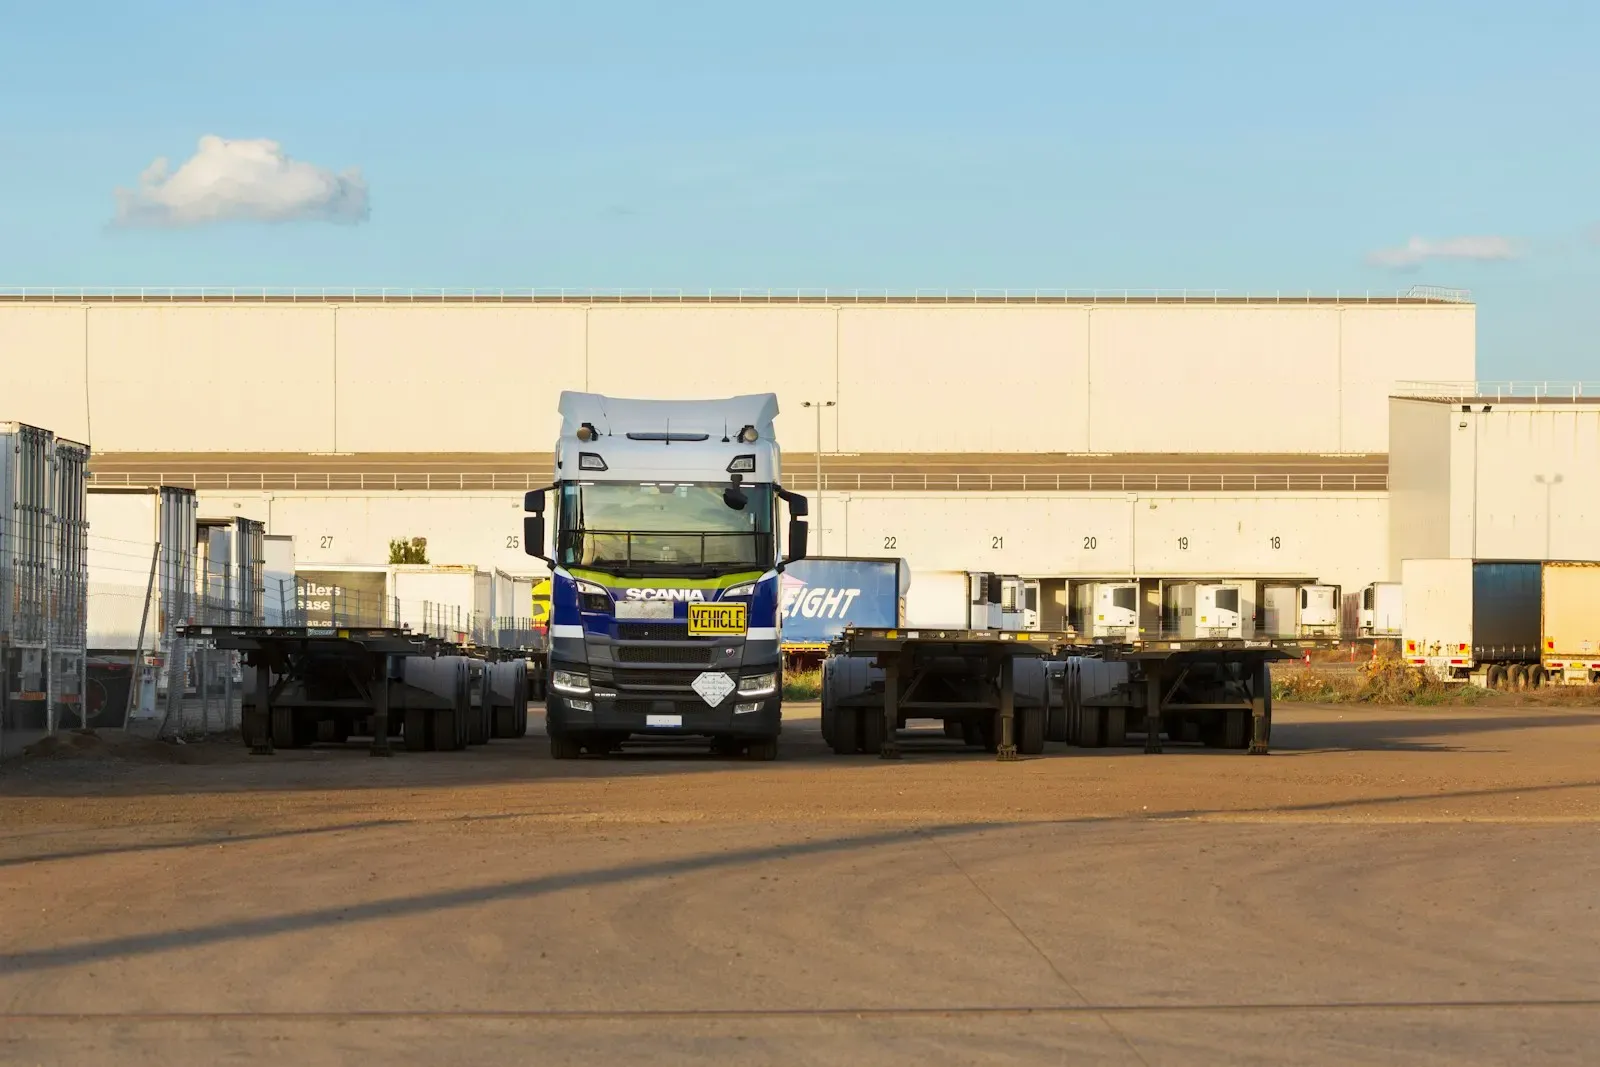
Production, purchasing, staffing and finance plan from the same reconciled forecast, so the month-end surprise becomes a ranked exception in week two.
Book a Planning CallWhat Planning Teams Say
 5.0Clutch
 5.0GoodFirms
- 5.0Google
- 4.9Upwork
I had the pleasure of working with Sajal Tech on a travel website, and it was an incredible experience from start to finish. They demonstrated professionalism, clear understanding of requirements, and excellent communication throughout.
Knowledgeable, efficient, and ahead of schedule. Will hire again.
They completed our project even when the scope changed slightly. They were cooperative when we wanted to add or modify features.
Demand Forecasting Cost
Indicative starting prices. Cloud usage is billed to your account.
Forecast backtest
- Scope
- Data review and a backtest against your current plan
- Timeline
- 2 to 3 weeks
from $2,500
Production forecasting
- Scope
- Hierarchical forecasts, dashboards and exceptions
- Timeline
- 6 to 10 weeks
from $12,000
S&OP platform
- Scope
- Scenarios, consensus workflow and ERP integration
- Timeline
- 3 to 5 months
from $35,000
What You Own at Handover
- Hierarchical forecasting models and their training code
- Backtest report by level and horizon against your current plan
- Planner dashboard with exceptions, overrides and versions
- Write-back into your ERP or planning tool
- Monitoring for accuracy, bias and data freshness
- Runbooks and a handover workshop for your planners
Demand Forecasting Questions
Still deciding? A 30-minute call usually answers the rest.
Ask Us DirectlyDemand forecasting plans what customers will want across the business; inventory forecasting turns that into stock and reorder decisions. Many clients use both.
Yes. Overrides are part of the workflow and are tracked, so you can see where human input improved or hurt accuracy.
From days to 18 months or more, with accuracy reported separately for each horizon.
Yes. Forecasts can be written to SAP IBP, Anaplan, Oracle or your ERP, or shown in Power BI and Tableau.
That is common. The first weeks focus on cleaning history, removing promotion effects and handling gaps.
Launch curves are built from similar past products, matched on category, price point, channel and season, then updated as the first weeks of real sales come in.
Yes. Scenarios can cap demand at available capacity or materials, so the plan shows both what customers want and what you can actually ship.
In your cloud account or warehouse. We follow ISO 27001 practices.
Let's build your next product together
Book a free strategy call and leave with a clear plan and estimate. No commitment.
- 01Pick a time that suits you
- 0230 minutes on scope, stack, timeline and budget
- 03Fixed-price proposal, NDA on request